Benchmarking Tool
The centerpiece of our benchmark is our custom-developed benchmarking tool. This tool allows us to send the previously collected states to the stream processing system under test (SUT) and collect the resulting data. Additionally, it enables us to gather various metrics that serve the purpose of comparing different systems and implementations with each other. Our tool provides a set of well-defined interfaces against which the stream processing system can be implemented. These interfaces include TCP, UDP, as well as adapters for Apache Kafka and ZeroMQ. When designing the benchmark, we made a conscious decision not to measure the individual operators of the stream processing system but rather focus on the system as a whole. This decision was motivated by our intention to address benchmarks towards systems that utilize modern hardware, where such operator-level measurements may not be feasible. Considering the expected data streams in the area of 10Gibt/s, measuring the individual operators would impose an additional burden on the system. Generating measurement data at the operator level, which would then need to be processed by our system, would introduce additional CPU, RAM, and potentially network overhead. This additional load could impact the performance of the SUT.

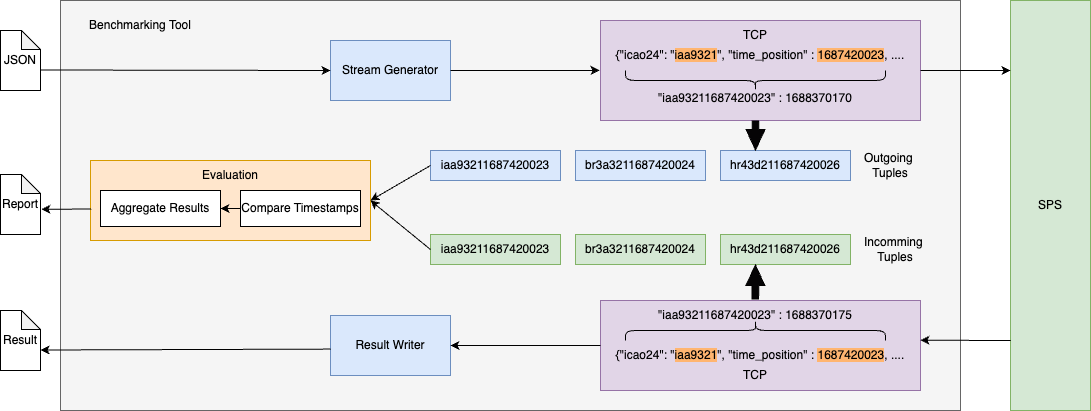
The benchmarking tool loads the JSON data from the drive and generates a data stream. Depending on the configuration by the user, the data is sent to the stream processing system (SPS) through one of the interfaces provided by us (TCP, UDP, Kafka, ZeroMQ). During the execution, a hash is computed using the icao24 and the _timeposition of the state. This key, along with a timestamp, is stored internally. Once the tuple reaches the benchmarking tool again, another hash and timestamp are computed and stored. The result tuple is then saved to disk. In a parallel process running concurrently with sending and receiving, the latencies of each tuple are calculated and stored for further analysis. Since some queries involve filtering tuples based on certain conditions, we cannot calculate the latency for all tuples. The calculation of latencies is only possible for queries that do not involve blocking operations, as this would disrupt the relationship between input and output. For these queries, only the throughput can be measured.
Benchmark Metric
There is a variety of metrics that can be used for measurement purposes. For SKYSHARK, we will specifically focus on two metrics.
End-to-End Latency
End-to-End Latency plays a crucial role in the deployment of stream processing systems. The time between the arrival of a tuple and its processing can have a significant impact on the precision of decisions. Therefore, we have identified this metric as an important measurement for SKYSHARK. With our benchmarking tool, we have full control over the sent and received tuples, allowing us to accurately determine tuple-level latency. To achieve this, the driver generates a key from the icao24 and _timeposition when sending the tuple. The key is stored with the current timestamp in a map. Once the tuple reaches the tool again, the key and a current timestamp are generated as well. A third process searches for the corresponding entry from sending for each incoming tuple and calculates the latency with nanosecond precision.
Throughput
Another significant metric in the field of stream processing is throughput. With our benchmarking tool, we can also measure throughput with high precision as we have full control over the incoming and outgoing tuples. Furthermore, using the aforementioned map where keys and timestamps are stored, we can measure the number of tuples that may have been lost during the process. By comparing the expected number of tuples with the actual number received, we can identify any potential tuple losses along the way.